Four Course in one Bundle only at Rs.4999 instead of the original price Rs.19000. BE AN ACTION TAKER. BUY THE COURSE NOW!
Latest Books
-

How to Attract Money
Rs. 300/- only
-

How to Remove Phobia of Losing Money in Stock Market
Rs. 2000/- only
-

Relaxation Techniques for Stock Market Investors & Traders
Rs. 2000/- only
Read More
Testimonials

MINA RAMAKHADI
I work as a graphic designer for 20 years but I had problems to handle my money but today when I attended this seminar today I didn�t knew how to invest in share market but now I have positive view towards investing in share market and I believe my problems will be over. And I want to tell everyone to attend the seminar and thank Nimish Sir.

NIRMAL SHAH
I am a C.A. student and from a long time I have been looking forward for the field of stock market and have been tracking it since 8th grade. Today by taking and attending the online course, I have found a right path to put my focus into. Thank you Nimish Sir.
AMITA DESAI
I attended seminar and I am doing the online course right now so first I thank Nimish Sir and his simple nature who wants only the best for their students and want them to become millionaires. He gives the best knowledge about market strategies which really deserves a complement. Different types of trading strategies, money and portfolio management in a very short period of time.

RAJESH PANCHAL
I don�t have a lot of knowledge about share market but I came here by seeing the hype of intraday and got to learn so much about it for that I would like to thank Nimish Sir. I got a lot of knowledge about stoploss scientific strategies which is not only going to help me but also the people who attended the session today.

SACHIN LABDE
Thankyou Nimish Sir for this online session. I earned enough amount of money but from that money how I can invest in the right place and grow is why I attended this online Course from throughout the day how much knowledge I received in near future. I sure am going to implement it and grow my wealth as Nimish Sir took a very deep subject and presented it to us very easily.

RAKESH VYAS
Before attentding this online session whatever myths I had about share market are all cleared the way Nimish Sir thought me how to deal in share market, How to use different tricks and keys was excellent and ways to attract money was amazing and it was a wonderful experience. So thank you Nimish Sir and Dhanashri Academy.
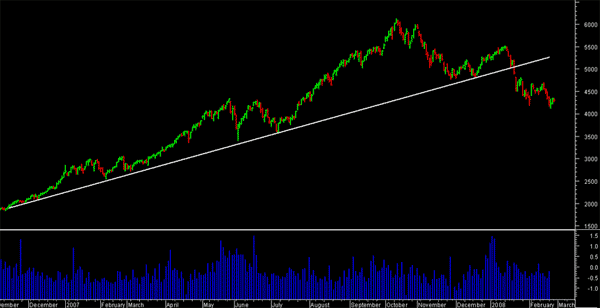
Trend line
Technical analysis is built on the assumption that prices trend. Trend Lines are an important tool in technical analysis for both trend identification and confirmation. A trend line is a straight line that connects two or more price points and then extends into the future to act as a line of support or resistance. Many of the principles applicable to support and resistance levels can be applied to trend lines as well.
Uptrend Line :
An uptrend line has a positive slope and is formed by connecting two or more low points. The second low must be higher than the first for the line to have a positive slope. Uptrend lines act as support and indicate that net-demand (demand less supply) is increasing even as the price rises. A rising price combined with increasing demand is very bullish, and shows a strong determination on the part of the buyers. As long as prices remain above the trend line, the uptrend is considered solid and intact. A break below the uptrend line indicates that net-demand has weakened and a change in trend could be imminent.
Downtrend Line :
A downtrend line has a negative slope and is formed by connecting two or more high points. The second high must be lower than the first for the line to have a negative slope. Downtrend lines act as resistance, and indicate that net-supply (supply less demand) is increasing even as the price declines. A declining price combined with increasing supply is very bearish, and shows the strong resolve of the sellers. As long as prices remain below the downtrend line, the downtrend is solid and intact. A break above the downtrend line indicates that net-supply is decreasing and that a change of trend could be imminent.
Copyright © 2019 Dhanashri Academy. All Rights Reserved.