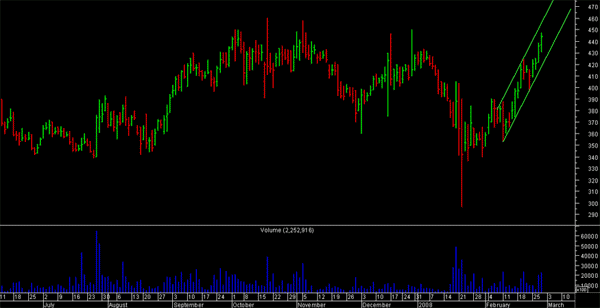
Trend Channel
Type of trend channel ascending Trend Channel and Descending Trend Channel.
Ascending Trend Channel : If connecting the price tops of a particular stock or index compose an upward-sloping line parallel to a line connecting the bottoms of that stock or index, the Ascending Trend Channel is the area between the two lines see the example below.

Resistance Turns Support: Broken resistance becomes potential support, and there is sometimes a test of this newfound support level with the first correction. Because the triple bottom is a long-term pattern, the test of newfound support may occur many months later. Price Target: The distance from the resistance breakout to lows can be measured and added to the resistance break for a price target. The longer the pattern develops, the more significant is the ultimate breakout. Triple bottoms that are 6 or more months in duration represent major bottoms and a price target is less likely to be effective.
As the triple bottom develops, it can start to resemble a number of patterns. Before the third low forms, the pattern may look like a double bottom. Three equal lows can also be found in a descending triangle or rectangle. Of these patterns mentioned, only the descending triangle has bearish overtones; the others are neutral until a breakout occurs. Similarly, the triple bottom should also be treated as a neutral pattern until a breakout occurs. The ability to hold support is bullish, but demand has not won the battle until resistance is broken. Volume on the last advance can sometimes yield a clue. If there is a sharp increase in volume and momentum, then the chances of a breakout increase.


